WCCOS
World Calibration Center for Ozone Sondes
Table of Contents
1 Introduction
The state of knowledge regarding long term trends of tropospheric as well as stratospheric ozone is limited due to inadequate global coverage of ozone sounding stations, poor assurance of data continuity and questionable homogeneity of data [WMO-Scientific Assessment of Ozone Depletion 1998: 1999]. Particularly, there is an urgent need for improved data quality which must be achieved by intercalibration and intercomparison of existing ozone sonde types as well as agreement through procedures for data processing and analysis [WMO-report No. 104, 1995, SPARC-IOC-GAW, 1998]. Several previous series of WMO-field intercomparisons where several different types of ozone sondes were simultaneously flown, have been conducted [Attmannspacher et al., 1970, 1981, and Kerr et al., 1994]. However, many questions with regard to the observed instrumental performance of the different ozone sondes were left unanswered. A key shortcoming was that in most intercomparisons no ozone reference standard was simultaneously flown.
Since 1996 the environmental simulation facility at Forschungszentrum Jülich established as World Calibration Center for Ozone Sondes (=WCCOS) of the WMO: a facility for quality assurance of ozone sondes used in GAW/GLONET focusing on ozone sonde precision, accuracy and long term stability. The controlled environment plus the fact that the ozone sonde measurements can be compared to an accurate UV-Photometer as reference [Proffitt and McLaughlin, 1983, Smit et al. 1994] allows to conduct experiments that are designed to address questions which arise from field operation. In 1996 the activities started with the Jülich Ozone Sonde Intercomparison Experiment (JOSIE-1996) which was attended by eight ozone sounding laboratories from seven countries and representing the major types of ozone sondes that are in routine operation in GAW/GLONET [Smit and Kley, 1998].
2 Simulation of Ozone Soundings
Ozone sondes are small, lightweight and compact balloon borne instruments, developed for measuring the vertical distribution of atmospheric ozone up to an altitude of about 35-40 km. The ozone sensor is mostly based on an electrochemical method. In Figure 2 the world wide used ECC (=Electrochemical Concentration Cell) ozone sonde, developed by Komhyr [1969], is shown.
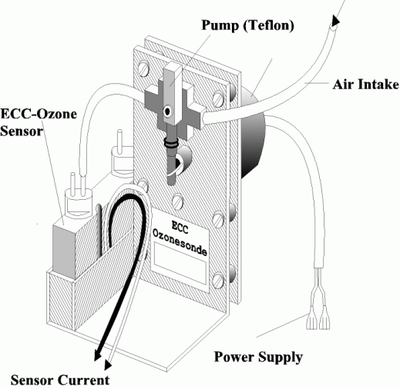
The principle of ozone measurement is thereby mostly based on the titration of ozone in a potassium iodide (KI) sensing solution according the redox reaction:
2 KI + O3 + H2O ¾ ¾ ® I2 + O2 + 2 KOH
The amount of generated "free" iodine (I2) is measured in electrochemical reaction cell(s). Continuous operation is achieved by a small electrically driven gas sampling pump which forces ambient air through the sensing solution of the electrochemical cell. Transported by the stirring action of the air bubbles, the iodine makes contact with a platinum cathode and is reduced back to iodide ions by the uptake of 2 electrons per molecule of iodine.
I2 + 2e ¾ Pt ® 2 I- [cathode reaction]
An electrical current proportional to the mass flow rate of ozone through the cell is generated. In principle, this type of electrochemical ozone sensor is an absolute measuring device. By knowing the gas volumetric pumping rate and the gas temperature the measured electrical current is converted to the ozone concentration in the sampled ambient air.
During normal flight operation, ozone sondes are coupled via special interfacing electronics with radiosondes for data transmission and additional measurement of meteorological parameters like pressure, temperature (optional humidity and wind). Total weight of the flight package is about 1 kg which can be flown on weather balloons. The data measured by the sonde is telemetered to the ground station for further data processing.
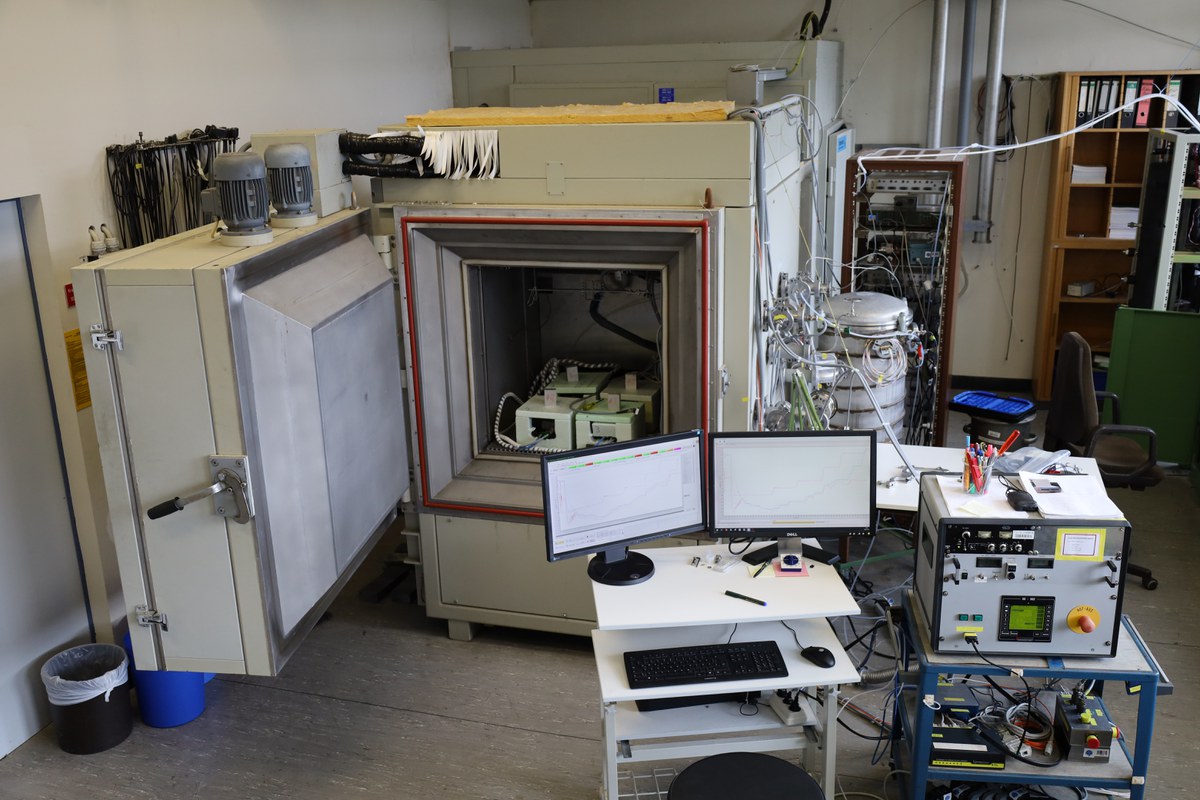
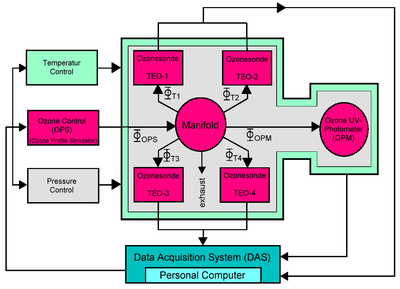
The experimental set up for the simulation of the vertical ozone soundings in the chamber is shown in Figure 1. Four ozone sondes can be "flown" simultaneously (see Figure 3) and compared to the UV-photometer. One of the major objectives of the experiments is to characterize and to determine precision and accuracy of the ECC-ozone sensor as a function of altitude and ozone level. Particularly the question is addressed in how far the data analysis is affected by procedures like background signal correction and total ozone column normalization.

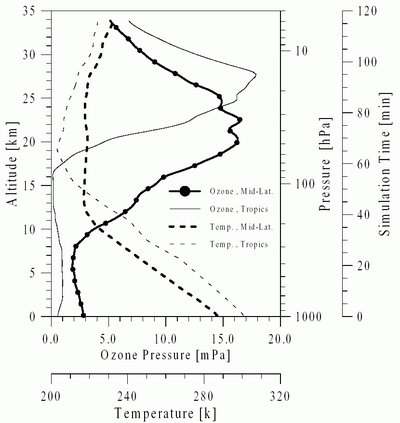
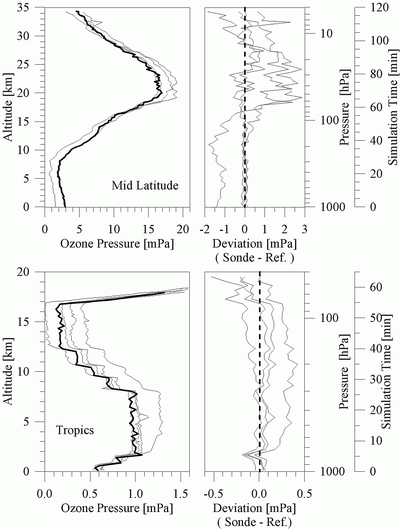
Different types of vertical profiles of pressure, temperature and ozone concentrations can be simulated. Two examples are shown in Figure 4. The first type of profile is a typical mid-latitude profile taken from the US-Standard Atmosphere (1976) for 40-50°N with a tropopause height of 12 km. The second type of profile relates to typical tropical conditions of high convective activity, high tropopause at 18 km and low tropopause temperature which means extremely low ozone values in the middle and upper troposphere [Kley et al., 1996]. In addition, different types of ozone step functions or zero ozone can be applied in order to investigate the response time and background characteristics of the different ozone sondes.
To illustrate the performance of the facility for the simulation of ozone soundings some results of a typical mid-latitude and tropical simulation run of four simultaneously "flown" sondes compared to the UV-photometer, which were obtained during JOSIE in 1996, are displayed in the upper and lower diagrams respectively of Figure 5.

In addition, Figure 6 shows the results of some time response tests of four different ozone sondes when ozone was temporarily set to zero during some simulation runs made during JOSIE.
The different experiments to simulate ozone soundings brought valuable information about the performance of the different ozone sonde types and the influence of the operating procedures for preparation and data correction on the data quality of ozone soundings. The simulation experiments showed also that there is a need to validate ozone sondes on a routine basis. Ozone sondes have gone through some modifications since they were first manufactured, which adds uncertainty to trend analysis. Routine testing of newly manufactured ozone sondes on a regular basis, following a standard operating procedure (SOP), will help to ensure more confidence in observed trends in the future. A pre-requisite thereby is the standardization of the preparation procedures and data correcting methods in the near future, but also a better and more detailed documentation of the procedures and methods applied in the past at the different long term ozone sounding stations. Therefore, in order to support the assessment of the standardization of preparation procedures of ozone sondes a second international ozone sonde intercomparison experiment (JOSIE-2000) has been conducted in September 2000. Pre-experiments sponsored by the WMO, prior to JOSIE-2000, have been performed in 1998 and 1999.
References
Attmannspacher, W. and H. Dütsch, International Ozone Sonde Intercomparison at the Observatory of Hohenpeissenberg, Berichte des Deutschen Wetterdienstes, 120, 1970.
Attmannspacher, W. and H. Dütsch, 2nd International Ozone Sonde Intercomparaison at the Observatory of Hohenpeissenberg, Berichte des Deutschen Wetterdienstes, 157, 1981.
Kerr, J.B., H.Fast, C.T. McElroy, S.J. Oltmans, J.A. Lathrop, E. Kyro, A. Paukkunen, H. Claude, U. Köhler, C.R. Sreedharan, T. Takao, and Y., Tsukagoshi, The 1991 WMO International Ozone Sonde Intercomparison at Vanscoy, Canada, Atm. Ocean, 32, 685-716, 1994.
Kley, D., P.J. Crutzen, H.G.J. Smit, H. Vömel, S.J. Oltmans, H. Grassl, and V. Ramanathan, Observations of near-zero ozone levels over the convective Pacific: Effects on air chemistry, Science, 274, 230-233, 1996.
Komhyr, W.D., Electrochemical concentration cells for gas analysis, Ann. Geoph., 25, 203-210, 1969.
Proffitt, M.H., and R.J. McLaughlin, Fast response dual-beam UV-absorption photometer suitable for use on stratospheric balloons, Rev. Sci. Instrum., 54, 1719-1728, 1983.
Smit, H.G.J., W. Sträter, D. Kley, and M.H. Proffitt, The evaluation of ECC-ozone sondes under quasi flight conditions in the environmental simulation chamber at Jülich, in P.M. Borell et al. (eds.), Proceedings of Eurotrac symposium 1994, 349-353, SPB Academic Publishing bv, The Hague, The Netherlands, 1994.
Smit, H.G.J., and D. Kley, Jülich Ozone Sonde Intercomparison Experiment (JOSIE), WMO Global Atmosphere Watch report series, No. 130 (Technical Document No. 926), World Meteorological Organization, Geneva, 1998.
SPARC-IOC-GAW Assessment of Trends in the Vertical Distribution of Ozone, SPARC report No.1, WMO Global Ozone Research and Monitoring Project Report No. 43, 1998.
U.S. Standard Atmosphere, NOAA, NASA, USAF, U.S. Government Printing Office, Washington, D.C., 1976.
WMO report No. 104, Report of the fourth WMO meeting of experts on the quality assurance/science activity centers (QA/SACs) of the global atmosphere watch. Jointly held with the first meeting of the coordinating committees of IGAC-GLONET and IGAC-ACE at Garmisch-Partenkirchen, Germany, 13-17 March 1995, WMO TD.No. 689, World Meteorological Organization, Geneva, 1995.
WMO (=World Meteorological Organization) , Scientific Assessment of Ozone Depletion: 1998, Global Ozone Research and Monitoring Project - Report No. 44, World Meteorological Organization, Geneva , 1999.
