Imaging analysis techniques
The physicochemistry laboratory is equipped with various analytical methods that allow high-resolution imaging of the physical properties of solid materials. These are used to study the composition of energy converters. Thus, temporal changes and degradation phenomena can be visualized. The knowledge gained in this way can help to increase the service life of components through targeted selection of the material combinations and operating parameters used.
Table of Contents
Scanning electron microscope (SEM)
A field emission scanning electron microscope (FE-REM) with attached energy dispersive X-ray spectroscopy (EDX) allows to study the morphology and chemical composition of a sample simultaneously. During scanning of the sample by the electron beam, secondary electrons are released from the sample, which are used to generate the microscopy image. Since the intensity of these secondary electrons depends on the work function of the material, this image already contains a material contrast. In order to identify the materials precisely, one takes advantage of the fact that the electron beam also triggers electronic transitions in the atomic shells, which lead to the emission of X-rays that have a characteristic energy spectrum for each element. By evaluating the specific X-ray lines as a false color diagram, a spatially resolved representation of the element distribution is obtained.
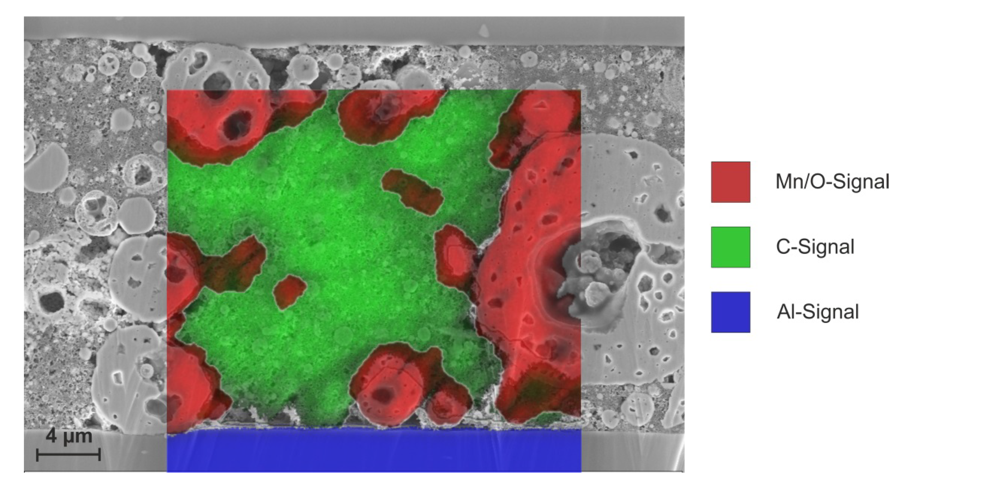
The figure shows a combined SEM/EDX measurement on a layered electrode of a lithium battery. The electrode consists of lithium nickel manganate mixed with a conductive carbon black. The individual layers of the electrode are separated by aluminum plates. The superimposed elemental distribution, determined by EDX, allows the lithium nickel manganate particles to be identified by the Mn/O signal and the conductive carbon black by the C signal. In addition, the sharp border to the aluminum separator can be seen at the bottom of the image. Such measurements were taken as a reference to analyze the formation of the capping layer at the electrode/electrolyte interface and thus gain insight into the aging processes of high-voltage batteries [1].
Nano-computed tomography (n-CT)
X-ray tomography can be used to record three-dimensional images of a sample with a maximum resolution of 500 nm. For this purpose, the material to be examined is transilluminated with X-rays at different angles of incidence. From the resulting images, the three-dimensional distribution of the material's absorption is calculated using a complex mathematical reconstruction procedure. In this way, not only the outer shape of the sample but also its inner structure can be imaged.
The video shows an investigation of a polymer electrolyte fuel cell. A membrane electrode assembly (MEA) consisting of two gas diffusion layers (GDL) and a coated catalyst membrane (CCM) was compressed between two flow field plates. The MEA was compressed by 30% between the plates. The width of the channels and ribs of the flow field plates is 1 mm for both sides. To investigate the mechanical influence of the displacement of the flow field plates on the CCM, two cases were compared: First, the ribs were maximally displaced against each other (in the video on the left) while in the reference case the ribs were positioned exactly on top of each other (in the video on the right). In the virtual cross-sections through the cells, it can be seen that the GDL penetrates further and further into the flow channel as the displacement increases, with the CCM undulating more and more [2]. Due to the resulting mechanical stresses, there is a risk of cracks appearing in the membrane during long-term operation, which can lead to premature wear of the cell. For the reference case, on the other hand, the MEA remains uncompressed on average at the point of maximum penetration (channel center). Such investigations can be used to optimize the geometry of the fuel cells and the flow plates.
Atomic force microscopy (AFM)
Atomic force microscopy (AFM) is used to image surface topography. For this purpose, a microstructured tip is scanned over the surface while the sample is positioned by means of piezo actuators in such a way that the force between the sample and the tip remains constant. The positional change of the sample can then be used to create a three-dimensional image of the surface topography with a resolution down to the sub-nanometer range. In addition to topography, a variety of other metrics can be recorded during scanning, depending on the mode of operation used. By using conductive tips, for example, the electrical properties of the surface can be mapped via conductivity or (Local Conductivity Atomic Force Microscopy, LC-AFM) or potential measurements (Scanning Kelvin Probe Force Microscopy, SKPM).
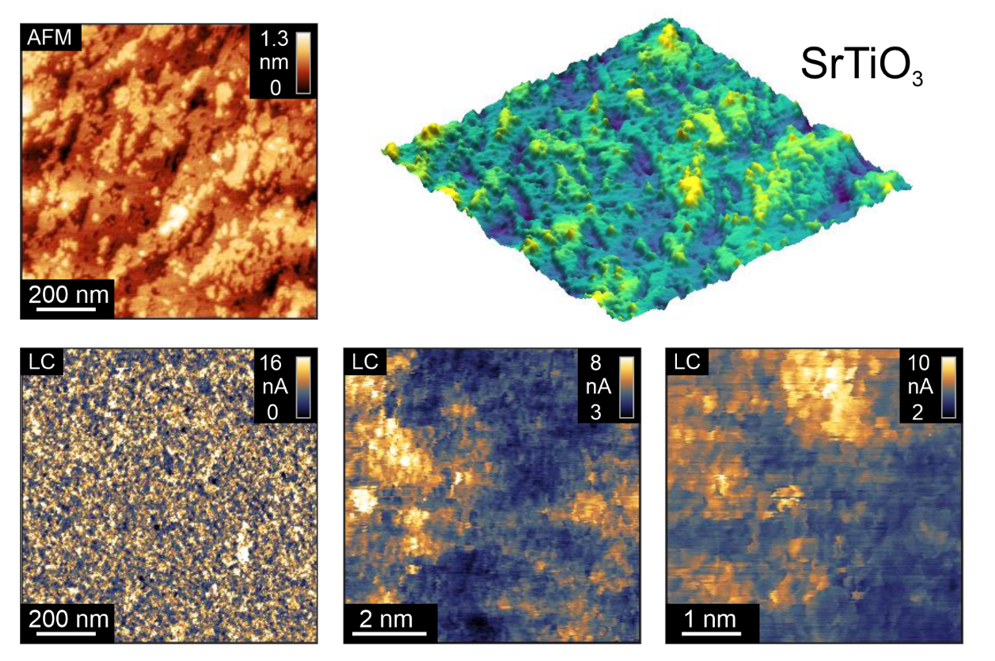
The figure shows a combined topography and conductivity measurement on strontium titanate, a model material for solid oxide fuel cell electrodes. Prior to the measurement, the crystal was heated under reducing conditions and the AFM measurement was performed in situ under ultra-high vacuum conditions to avoid surface contamination. It can be seen that the surface is very flat and terraces with a height in the range of the lattice constant have formed. The simultaneously recorded local conductivity (LC) signal reveals that the solid oxide has become electronically conductive due to the reduction, and meets the requirement for use as an electrode material. With high-resolution measurements of the local current distribution, in which even individual atoms can be detected, it was shown that the reduction in the material is not homogeneous, but that conducting channels form along dislocations that are very easily reducible [3]. These investigations can help to understand the influence of structural defects or grain boundaries on the function of a fuel cell.
Optical microscopy (OM)
Optical microscopy in reflected-light mode is used to make small structures in the micrometer range visible. The different imaging methods brightfield, darkfield, phase contrast and differential interference contrast are available. By selecting objectives with different magnifications, both overview and detail images can be acquired. The specimen stage can be moved automatically to acquire images with extended depth of field or topography images.
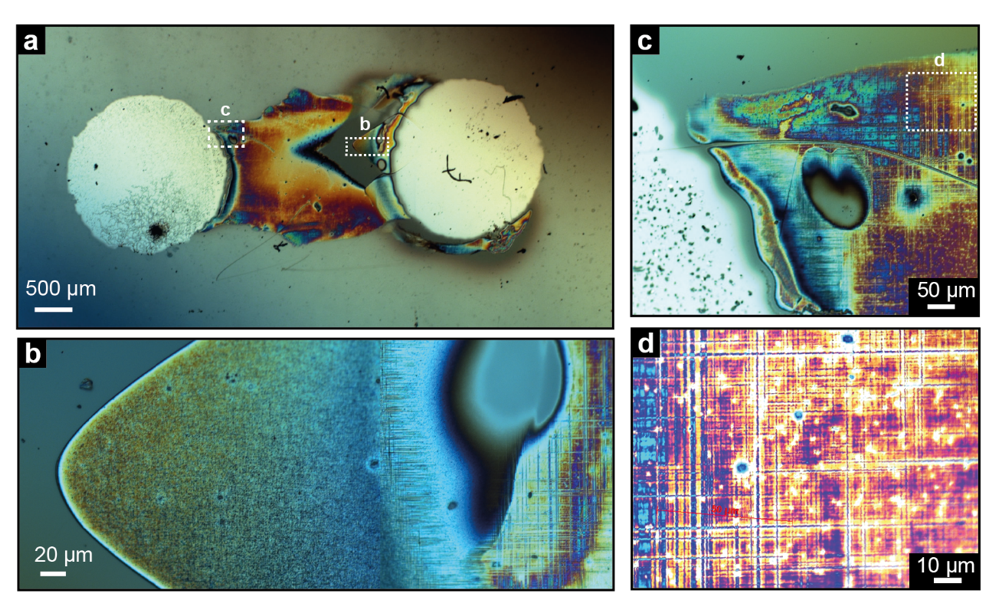
As an example, images of an electro-reduced yttrium-doped zirconium dioxide crystal are shown. This material is a good ionic conductor and is therefore used, for instance, as an electrolyte in solid oxide fuel cells. However, under high electric fields and reducing conditions, reduction phenomena can occur that locally alter the material and convert it into an electronic conductor. To make such processes visible, a current was induced into the crystal via two circular platinum electrodes, whereupon a coloration of the material and a change in the surface occurred in the region between the electrodes. These changes could be studied by phase contrast microscopy. Figure a) shows an overview of the electroreduced region while magnifications c-d in the region of the anode and cathode, respectively, show that a characteristic stripe structure aligned along the crystal axes has formed [4].
References
[1] Klaus Wedlich, Untersuchungen zur Deckschichtbildung auf LiNi0,5Mn1,5O4-Hochvoltkathoden, Dissertation RWTH Aachen University (2017)
https://doi.org/10.18154/RWTH-2017-07889
[2] Eugen Hoppe, Holger Janßen, Martin Müller, Werner Lehnert, The impact of flow field plate misalignment on the gas diffusion layer intrusion and performance of a high-temperature polymer electrolyte fuel cell, Journal of Power Sources, 501, 230036 (2021)
https://doi.org/10.1016/j.jpowsour.2021.230036
[3] Christian Rodenbücher, Dominik Wrana, Thomas Gensch, Franciszek Krok, Carsten Korte, Krzysztof Szot, The Electronic Properties of Extended Defects in SrTiO3—A Case Study of a Real Bicrystal Boundary, Crystals, 10, 665 (2020)
https://doi.org/10.3390/cryst10080665
[4] Christian Rodenbücher, Kristof Szot, Dominik Wrana, Benedykt R. Jany, Franciszek Krok, Carsten Korte, Localized electrochemical redox reactions in yttria-stabilized zirconia single crystals, J. Phys.: Energy, 2, 034008 (2020)
https://doi.org/10.1088/2515-7655/ab6b39